


Mon AM: 2010 ACC Returning Offensive Percentages
NOW: 2009 ACC Offensive Touchdown Rates
Tue PM: 2009 ACC Defensive Touchdown Rates
Wed AM: 2009 ACC Offensive Turnover Rates
Wed PM: 2009 ACC Defensive Turnover Rates
Thu AM: 2009 ACC Offensive Loss Rates
Thu PM: 2009 ACC Defensive Loss Rates
Fri AM: 2009 ACC Offensive Red Zone Rates
Fri PM: 2009 ACC Defensive Red Zone Rates
We start Day 2 of Stats Week with a look at offensive touchdown rates in conference play last season. It's pretty simple. You take number of rush and pass plays and divide by number of rushing and passing touchdowns. All stats are from the incomparable CFBStats.com and use stats from conference games only.

That's a little tough to read because of how many columns it had to be. Because the NCAA erroneously counts sacks as rushing plays, they have to be removed from the "Rush" column and added to the "Pass" column using Excel because I suck at math. After those tweaks, the Hokies had the lowest pass per touchdown rate through the air (good when you're on offense) due in large part to throwing the second-fewest passes in the ACC. Florida State has the lowest rush per touchdown rate and was also down at the bottom in rush plays in the conference.
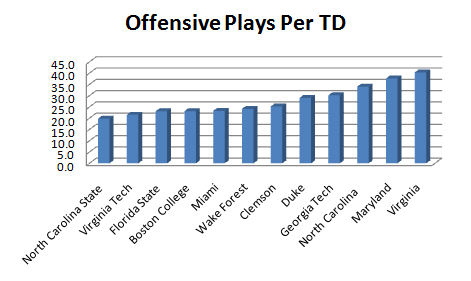
When you look at plays per touchdown for overall offense, NC State is the surprising winner. The Wolfpack ran only plays for each touchdown they scored. The top three (State, Tech, FSU) all have legit dual-threat quarterbacks.
The question becomes this: How much can you really take away from these numbers. NC State scored points with a quickness, but they weren't even bowl eligible. Georgia Tech is in the bottom third of this graph, but that's right where it wants to be. The Jackets are a ball control offense and if they're in the bottom half or bottom third, Paul Johnson's offense is doing just what he wants it to do.
Virginia Tech, meanwhile, probably doesn't want to be No. 2 on this graph. It wants to be down where Georgia Tech is since it also runs predominantly a ball-control offense where a delicate balance is needed between putting points on the board and keeping the defense rested and on the sidelines.
It interests me that for all the grief Bryan Stinespring gets, he still put points on the board quicker than 10 other ACC teams last year. Unfortunately, Tech also ran the second-fewest plays last year which is something the Hokies never want to do. Two years ago, when Stiney was really under fire from a lot of people, the offense ran the second-most plays of any team, kept the defense fresh and helped Virginia Tech win a conference title.