


With our ability to display live stats this season we have seen our database size increase significantly mainly due to the loads of data that we are tracking. One of the items we are now tracking is shot data for every shot taken. For select games we even get an X,Y coordinate of where the shot was taken on the floor. From those coordinates we can get some really interesting data. While the sample size isn't quite as big as we would like, it still makes for an interesting topic.
This topic was touched on by Ken Pomeroy a few years ago, but I thought it would be interesting to revisit and see how the new three point line may have effected things.
The graph below shows FG% on the Y axis and shot distance on the X axis. Pretty self-explanatory, right?
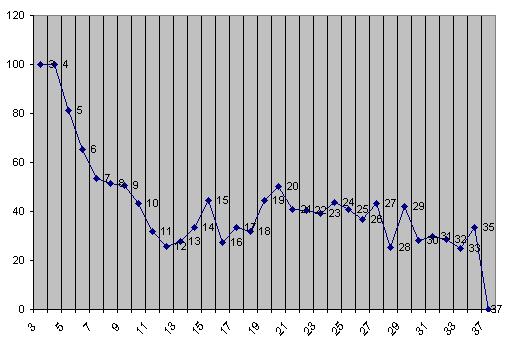
A simple expectation would be that as the shot gets further away from the basket you would expect FG% to drop. The graph above certainly leans toward this trend, but there are exceptions between 11-14 feet and 16-18 feet, otherwise known as the dreaded in-between game.
Think back to your days on the blacktop and the shots you took, lay-ups, free throws, three pointers, right? Maybe for some older than myself, the three point shot was a non-factor (which brings up an interesting discussion of what this graph would have looked like pre-three point shot), but let's focus on apples & apples for now. There is absolutely a drop-off in FG% between those three sets of shots, and one would imagine it is due to a lack of practice, but also there is another factor.
There's no debate that the 16-18 foot shot is the lowest percentage shot in college basketball. On top of the low shooting percentage, the risk for the shot is higher as a few steps back simply offers more reward for a made basket.
A similar debate can be made for the 11-14 foot shot. A closer shot would offer a higher success rate and a higher likelihood of drawing a foul.
So, the graph is pretty, the analysis is pretty intuitive, but what are teams gathering from this type of information? One, if you haven't read this article featuring former Duke forward, Shane Battier, you're missing out on a new way of thinking about basketball.
While we're not breaking this down to a player level yet, teams can still gather quite a bit of information. Simply put, teams should try to make their opponents take more shots in the lower percentage areas.
It starts with pressuring the perimeter and guarding the 3 point shot out to around 25 feet. The pressure on the perimeter might allow an offensive player to get a step around you but as long as you can recover before giving up a lay-up, the risk is acceptable. At the basket, you need significant resistance. This can come in one of two ways, the block shot or the charge. Either can force a player to pull up and take lower percentage shot.
There are multiple ways of doing this but no team does this as well as Duke. The Blue Devils pressure the ball out to half court and are among the ACC leaders in opponents three point percentage every season. To counter this, teams often attack the Blue Devils off the dribble but that's where the Blue Devils next line of defensive resistance is found, the charge. Flop or not, no team has used the charge like Duke has over the past decade. While Duke hasn't been the best example this season, mainly due to lack of perimeter quickness, Duke's opponents' FG% is typically among the best in the conference and nationally.
Getting back to the new three point line, which was moved back from 19'9" to 20'9", Pomeroy's graph (linked above) shows that there is a peak in shooting at the 20 foot mark. Our graph above shows the same peak and a drop-off outside of that by 5-10 percentage points. For this reason, you can certainly see why the change was made by the NCAA.
We can do a lot more with this data, and likely will as time goes by, including breaking the floor into different segments and seeing how shooting percentages are affected by not only distance but also by location on the floor. Look for that sometime in the future.
Have a thought on this analysis? Let us know in the comments section below!